
Have you known someone who needed an MRI (magnetic resonance imaging) scan for a medical condition, or have you needed one yourself? Have you ever observed someone in an airport security line having their belongings wiped down with a pad which was then placed in some kind of analytical instrument? Have you wondered how scientists determine the structures of compounds found in nature, or have you known a fellow student in a laboratory class who extracted bark, leaves, or fruit to isolate and identify some natural compounds? Or have you wondered how forensic evidence is analyzed in criminal cases, or how pesticides are identified in food samples?
If you have wondered about any of these things, then some of your curiosity will be satisfied by learning about spectroscopic methods such as nuclear magnetic resonance (NMR) spectroscopy, which involves the same physical principles as MRI imaging, and MS (mass spectrometry), which is used in some airport screening processes as well as many forensic applications. NMR and MS are workhorse techniques for the study of both biological and nonbiological molecular structure.
What is Spectroscopy?
Spectroscopy is the study of the interaction of energy with matter.
When energy is applied to matter, it can be absorbed, emitted, cause a chemical change, or be transmitted.
In this article, we’ll see how detailed information about molecular structure can be obtained by interpreting results from the interaction of energy with molecules. In our study of nuclear magnetic resonance (NMR) spectroscopy we’ll focus our attention on energy absorption by molecules that have been placed in a strong magnetic field.
Nuclear Magnetic Resonance – NMR Spectroscopy
The nuclei of certain elements, including 1H nuclei (protons) and 13C (carbon-13) nuclei, behave as though they were magnets spinning about an axis. When a compound containing protons or carbon-13 nuclei is placed in a very strong magnetic field and simultaneously irradiated with electromagnetic energy of the appropriate frequency, nuclei of the compound absorb energy through a process called magnetic resonance. The absorption of energy is quantized.
A graph that shows the characteristic energy absorption frequencies and intensities for a sample in a magnetic field is called a nuclear magnetic resonance (NMR) spectrum.
As a typical example, the proton (1H) NMR spectrum of 1-bromoethane is shown in Figure below. We can use NMR spectra to provide valuable information about the structure of any molecule we might be studying. In the following sections we’ll explain how four features of a molecule’s proton NMR spectrum can help us arrive at its structure.
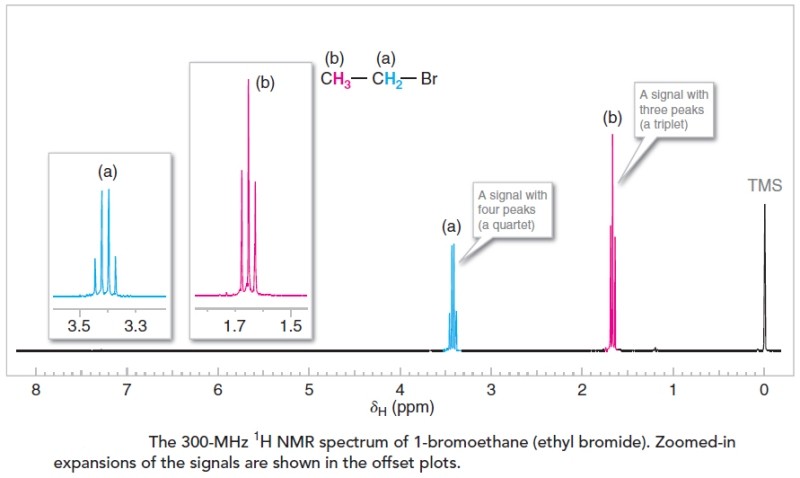
- The number of signals in the spectrum tells us how many different sets of protons there are in the molecule. In the spectrum for 1-bromoethane there are two signals arising from two different sets of protons. One signal (consisting of four peaks) is shown in blue and labeled (a). The other signal (consisting of three peaks) is in red and is labeled (b). These signals are shown twice in the spectrum, at a smaller scale on the baseline spectrum, and expanded and moved to the left above the base spectrum. [Don’t worry now about the signal at the far right of the spectrum (labeled TMS); it comes from a compound (tetramethylsilane) that was added to the 1-bromoethane so as to calibrate the positions of the other signals.]
- The position of the signals in the spectrum along the x-axis tells us about the magnetic environment of each set of protons arising largely from the electron density in their environment.
- The area under the signal tells us about how many protons there are in the set being measured.
- The multiplicity (or splitting pattern) of each signal tells us about the number of protons on atoms adjacent to the one whose signal is being measured. In 1-bromoethane, signal (a) is split into a quartet of peaks by the three protons of set (b), and signal (b) is split into a triplet of peaks by the two protons of set (a).
Chemical Shift
- The position of a signal along the x-axis of an NMR spectrum is called its chemical shift.
- The chemical shift of each signal gives information about the structural environment of the nuclei producing that signal.
- Counting the number of signals in a 1H NMR spectrum indicates, at a first approximation, the number of distinct proton environments in a molecule.
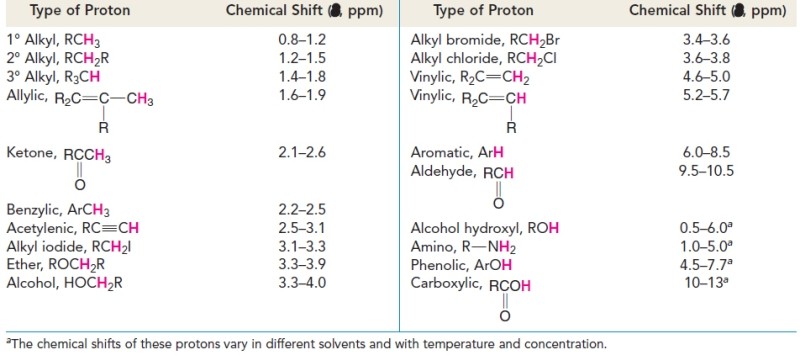
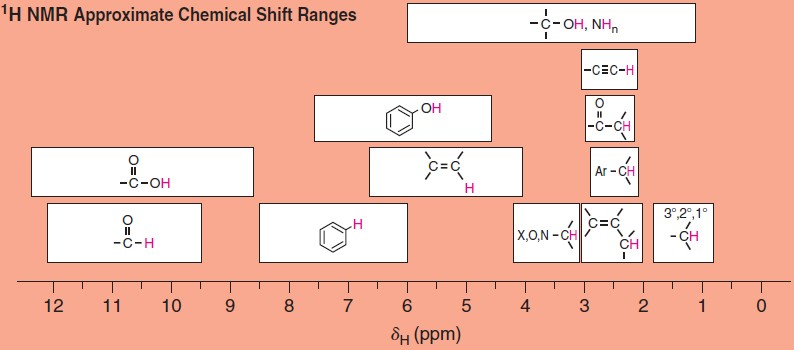
Tables and charts have been developed that allow us to correlate chemical shifts of NMR signals with likely structural environments for the nuclei producing the signals. 1H NMR chemical shifts generally fall in the range of 13–0 ppm (d).
The chemical shift of a signal in an NMR spectrum depends on the local magnetic environment of the nucleus producing the signal. The local magnetic environment of a nucleus is influenced by electron density and other factors. The physical meaning of chemical shift values relates to the actual frequency of the NMR signals produced by the nuclei. The practical importance of chemical shift information is that it gives important clues about molecular structure. Each NMR signal indicates the presence of nuclei in a different magnetic environment.
Chemical shifts are measured along the spectrum axis using a delta (δ) scale, in units
of parts per million (ppm). When comparing one signal with another:
- A signal that occurs further to the left in the spectrum than another (i.e., at a higher δ or ppm value) is said to occur downfield.
- A signal to the right is said to occur upfield.
The terms upfield and downfield relate to the strength of the magnetic field (higher versus lower, respectively) that is required to bring the nuclei into resonance.
The 1H NMR spectrum of 1,4-dimethylbenzene (p-xylene), shown in Figure below, is a simple example that we can use to learn how to interpret chemical shifts. First, note that there is a signal at δ 0. The signal at δ 0 is not from 1,4-dimethylbenzene, but from tetramethylsilane (TMS), a compound that is sometimes added to samples as an internal standard to calibrate the chemical shift scale. If the signal from TMS appears at zero ppm, the chemical shift axis is calibrated correctly.
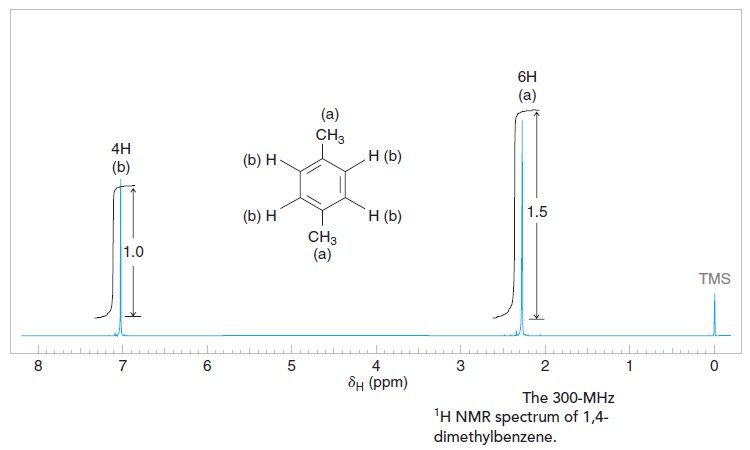
Next we observe that there are only two other signals in the 1H NMR spectrum of 1,4-dimethylbenzene, at approximately δ 7.0 and δ 2.3. The existence of just two signals implies that there are only two distinct proton environments in 1,4-dimethylbenzene, a fact we can easily verify for ourselves by examining its structure.
We say, then, that there are “two types” of hydrogen atoms in 1,4-dimethylbenzene, and these are the hydrogen atoms of the methyl groups and the hydrogen atoms of the benzene ring. The two methyl groups produce only one signal because they are equivalent by virtue of the plane of symmetry between them. Furthermore, the three hydrogen atoms of each methyl group are equivalent due to free rotation about the bond between the methyl carbon and the ring. The benzene ring hydrogen atoms also produce only one signal because they are equivalent to each other by symmetry.
Referring to Chemical Shifts Table given above, we can see that 1H NMR signals for hydrogen atoms bonded to a benzene ring typically occur between δ 6 and 8.5, and that signals for hydrogen atoms on an sp3 carbon bonded to a benzene ring (benzylic hydrogens) typically occur between δ 2 and 3. Thus, chemical shifts for the signals from 1,4-dimethylbenzene occur where we would expect them to according to NMR spectral correlation charts.
In the case of this example, the structure of the compound under consideration was known from the outset. Had we not known its structure in advance, however, we would have used chemical shift correlation tables to infer likely structural environments for the hydrogen atoms. We would also have considered the relative area of the signals and signal multiplicity, and many other factors.
Integration of Signal Areas
The area under each signal in a 1H NMR spectrum is proportional to the number of hydrogen atoms producing that signal.
In the 1H NMR spectrum of 1,4-dimethylbenzene, you may have noticed curves that resemble steps over each signal. The height of each step (using any unit of measure) is proportional to the area of the NMR signal underneath it, and also to the number of hydrogen atoms giving rise to that signal. Taking the ratio of the step height associated with one signal to the step height associated with another provides the ratio of the areas for the signals, and therefore represents the number of hydrogen atoms producing one signal as compared to the other. Note that we are discussing the height of the integral steps, not the heights of the signals. It is signal area (integration), not signal height, that is important.
The area under each signal (shown with blue shading above) is what is measured (integrated) and taken as a ratio to compare the relative numbers of hydrogen atoms producing each signal in an NMR spectrum.
In Figure of NMR Spectrum of 1,4-dimethylbenzene we have indicated the relative step heights as 1.0 and 1.5 (in dimensionless units). Had these values not been given, we would have measured the step heights with a ruler and taken their ratio. Since the actual number of hydrogen atoms giving rise to the signals is not likely to be 1 and 1.5 (we cannot have a fraction of an atom), we can surmise that the true number of hydrogens producing the signals is probably 2 and 3, or 4 and 6, etc. For 1,4-dimethylbenzene the actual values are, of course, 4 and 6.
Whether NMR data are provided as in Figure of NMR Spectrum of 1,4-dimethylbenzene with an integral step over each signal, or simply with numbers that represent each signal’s relative area, the process of interpreting the data is the same because the area of each signal is proportional to the number of hydrogen atoms producing that signal. (It is important to note that in 13C NMR spectroscopy signal area is not relevant in routine analyses.)
Coupling (Signal Splitting)
Coupling, also referred to as signal splitting or signal multiplicity, is a third feature of 1H NMR spectra that provides very useful information about the structure of a compound.
Coupling, also referred to as signal splitting or signal multiplicity, is a third feature of 1H NMR spectra that provides very useful information about the structure of a compound.
The effect of the nearby hydrogens is to split (or couple with) the energy levels of the hydrogens whose signal is being observed, and the result is a signal with multiple peaks. (Notice that we have been careful to differentiate use of the words signal and peak. A group of equivalent atoms produces one signal that may be split into multiple peaks.) however, the importance of coupling is that it is predictable, and it gives us specific information about the constitution of the molecule under study.
The typical coupling we observe is from nonequivalent, vicinal hydrogens, that is, from hydrogens on adjacent carbons, separated by three bonds from the hydrogens producing the signal. Coupling can also occur between nonequivalent geminal hydrogens (hydrogens bonded to the same carbon) if the geminal hydrogens are in a chiral or conformationally restricted molecule.
A simple rule exists for predicting the number of peaks expected from vicinal coupling in 1H NMR:
Number of peaks from vicinal coupling in a 1H NMR signal = n + 1
Where n is the number of vicinal hydrogen atoms that are nonequivalent to those producing the signal.
This rule is applicable in general to achiral molecules without conformational barriers. The 1H NMR spectrum of 1,4-dimethylbenzene is an example where n = 0 (in the above equation) regarding the hydrogen atoms producing the signals at δ 7.0 and at δ 2.3. There are no hydrogen atoms on the carbons adjacent to the methyl groups; hence n=0 for the signal at δ 2.3, and the signal is a singlet (signals with only one peak are called singlets). And, since all of the hydrogen atoms on the ring are equivalent by symmetry and there are no adjacent nonequivalent hydrogen atoms, n=0 for the hydrogens on the ring producing the signal at δ 7.0, and hence this signal is a singlet as well.
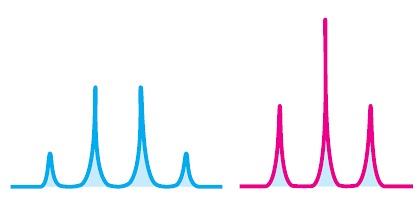
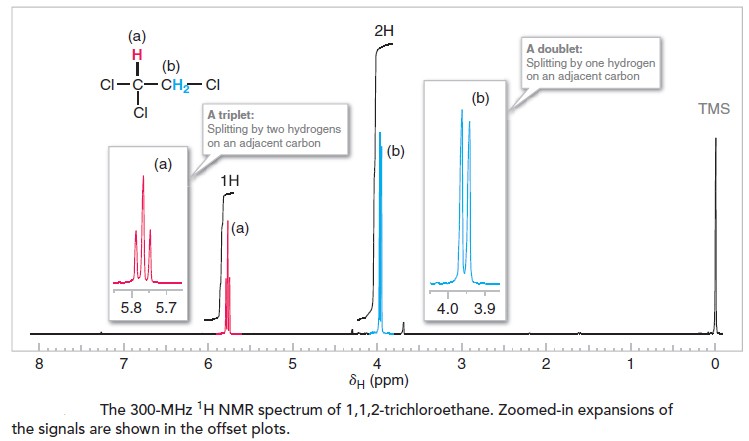
The 1H NMR spectrum of 1,1,2-trichloroethane, shown in Figure below, provides an example where n is not equal to zero, and coupling is therefore evident. In the spectrum of 1,1,2-trichloroethane we see two signals: one with three peaks and one with two peaks. These signals are called, respectively, a triplet and a doublet. The signal for the CHCl2
hydrogen is a triplet because there are two hydrogen atoms on the adjacent carbon (n=2). The signal for the CH2Cl hydrogens is a doublet because there is one hydrogen on the adjacent carbon (n=1).
You may like to free download following books:
- Understanding NMR Spectroscopy (2nd Ed.) By James Keeler
- Solving Problems with NMR Spectroscopy (2nd Ed.) By Atta-ur-Rahman, Muhammad Iqbal Choudhary and Atia-tul-Wahab
- NMR Spectroscopy Explained: Simplified Theory, Applications and Examples for Organic Chemistry and Structural Biology By Neil E. Jacobsen