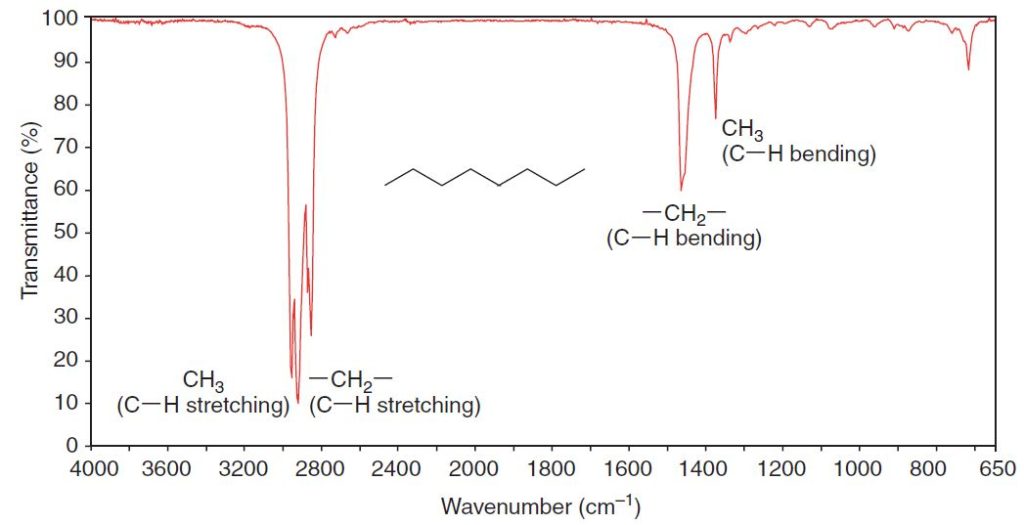
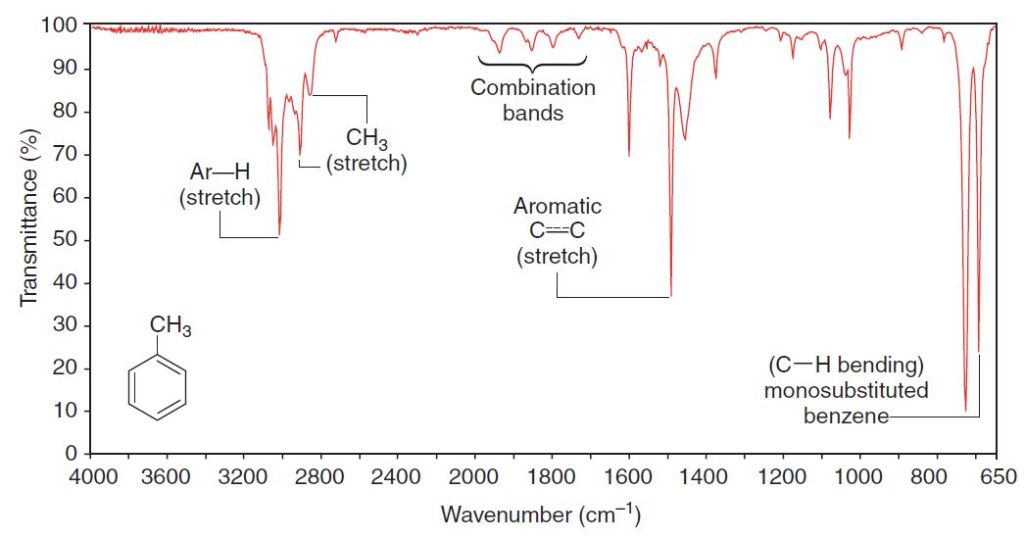
IR spectra contain a wealth of information about the structures of compounds. We show some of the information that can be gathered from the spectra of octane and methylbenzene (commonly called toluene) in Figs. 2.1 and 2.2. In this section we shall learn how to recognize the presence of characteristic IR absorption peaks that result from vibrations of alkyl and functional groups.
The data given in above article will provide us with key information to use when correlating actual spectra with IR absorption frequencies that are typical for various groups.


Infrared Spectra of Hydrocarbons
All hydrocarbons give absorption peaks in the 2800–3300-cm-1 region that are associated with carbon hydrogen stretching vibrations.
We can use these peaks in interpreting IR spectra because the exact location of the peak depends on the strength (and stiffness) of the C-H bond, which in turn depends on the hybridization state of the carbon that bears the hydrogen. The C-H bonds involving sp-hybridized carbon are strongest and those involving sp3-hybridized carbon are weakest.
The order of bond strength is
sp > sp2 > sp3
This, too, is the order of the bond stiffness.
The carbon–hydrogen stretching peaks of hydrogen atoms attached to sp-hybridized carbon atoms occur at highest frequencies, about 3300 cm-1
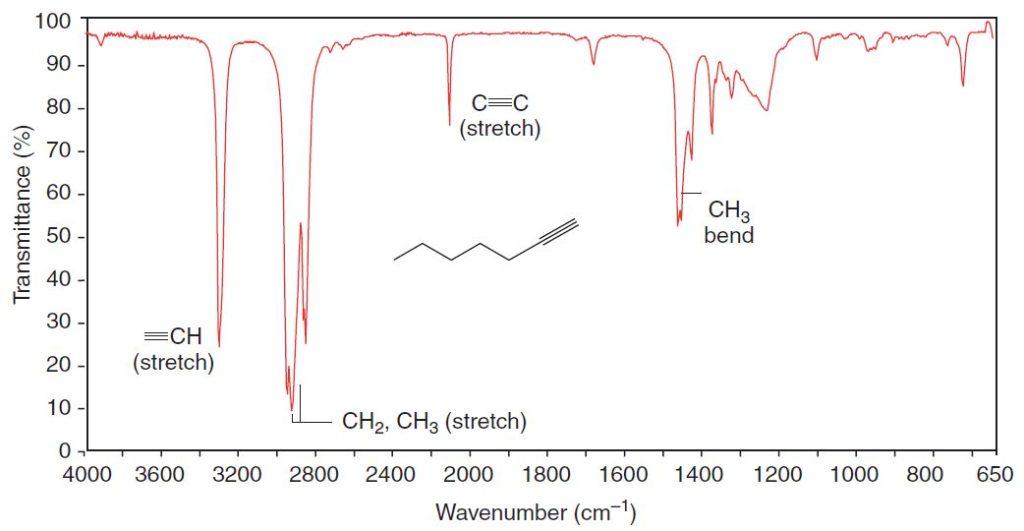
The carbon–hydrogen bond of a terminal alkyne ( 𝄘C−H) gives an absorption in the 3300-cm-1 region. We can see the absorption of the acetylenic (alkynyl) C−H bond of 1-heptyne at 3320 cm-1 in Fig. 2.3.

The carbon–hydrogen stretching peaks of hydrogen atoms attached to sp2 hybridized carbon atoms occur in the 3000–3100-cm-1 region.
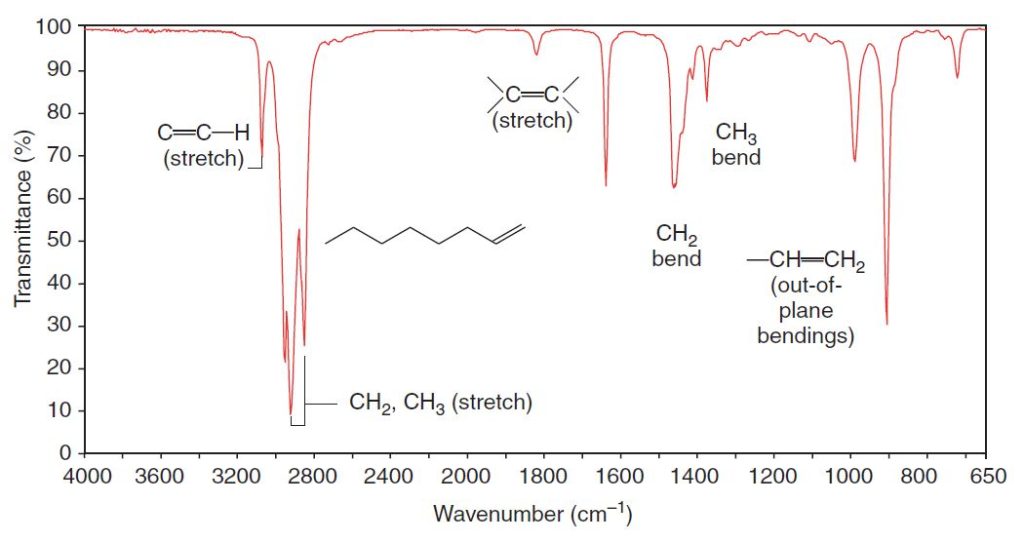
Thus, alkenyl C-H bonds and the C-H groups of aromatic rings give absorption peaks in this region. We can see the alkenyl C-H absorption peak at 3080 cm-1 in the spectrum of 1-octene (Fig. 2.4), and we can see the C-H absorption of the aromatic hydrogen atoms at 3090 cm-1 in the spectrum of methylbenzene (Fig. 2.2).
The carbon–hydrogen stretching bands of hydrogen atoms attached to sp3-hybridized carbon atoms occur at lowest frequencies, in the 2800–3000cm-1 region.
We can see methyl and methylene absorption peaks in the spectra of octane (Fig. 2.1),
methylbenzene (Fig. 2.2), 1-heptyne (Fig. 2.3), and 1-octene (Fig. 2.4).

Hydrocarbons also give absorption peaks in their IR spectra that result from carbon-carbon bond stretching. Carbon–carbon single bonds normally give rise to very weak peaks that are usually of little use in assigning structures. More useful peaks arise from carbon–carbon multiple bonds, however.
Carbon–carbon double bonds give absorption peaks in the 1620–1680cm-1 region, and carbon–carbon triple bonds give absorption peaks between 2100 and 2260cm-1.
These absorptions are not usually strong ones, and they are absent if the double or triple bond is symmetrically substituted. (No dipole moment change will be associated with the vibration.) The stretchings of the carbon–carbon bonds of benzene rings usually give a set of characteristic sharp peaks in the 1450–1600-cm-1 region.
Absorptions arising from carbon–hydrogen bending vibrations of alkenes occur in the 600–1000cm-1 region. With the aid of a spectroscopy handbook, the exact location of these peaks can often be used as evidence for the substitution pattern of the double bond and its configuration.
Free Download Following Books:
- Fundamentals of Fourier Transform Infrared Spectroscopy (2nd Ed.) By Brian Smith
- Introduction to Experimental Infrared Spectroscopy Fundamentals and Practical Methods By Mitsuo Tasumi
- Modern Spectroscopy (4th Ed.) By J. Michael Hollas
- Spectroscopic Identification of Organic Compounds (8th Ed.) By Robert M. Silverstein, Francis X. Webster, David J. Kiemle and David L. Bryce
